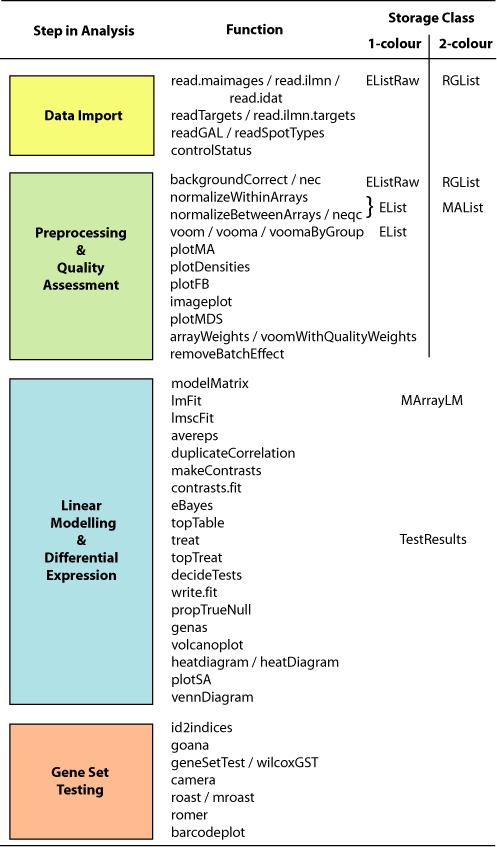
Figure 2.

The limma workflow. The diagram shows the main steps in a gene expression analysis, along with individual functions that might be used and the corresponding classes used to store data or results. Online documentation pages are available both for each individual function and for each major step.
