Figure 4.

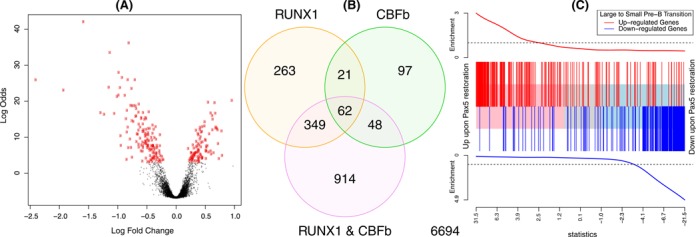
Example plots displaying results from DE and gene set analyses. (A) Volcano plot showing fold changes and posterior odds of DE for a particular comparison (RUNX1 over-expression versus wild-type in this case), generated by volcanoplot. Probes with P < 0.00001 are highlighted in red. (B) Venn diagram showing overlap in the number of DE genes for three comparisons from the same study as (A), generated by the vennDiagram function. (C) Gene set enrichment plot produced by barcodeplot. The central bar orders differentially expressed genes by significance from up to down upon Pax5 restoration in an RNA-seq experiment (7). The vertical bars mark genes that are induced (red) or repressed (blue) upon the transition from large cycling pre-B cells to small resting pre-B cells during normal B cell development according to the published literature (47). The plot shows a strong positive concordance between Pax5 restoration and the large to small cell transition. The roast function can be used to assign statistical significance to this correlation.
