
Figure 3.
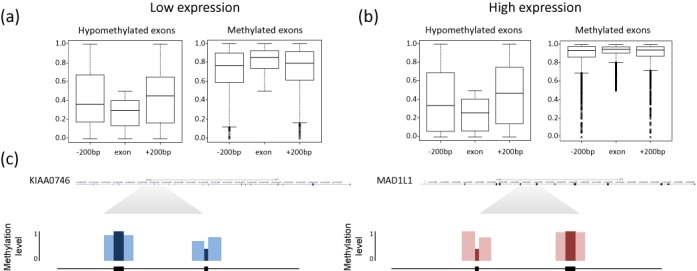
Hypomethylated exons are less methylated than their surroundings in high and low expressed genes. The distribution of DNA methylation rates is shown for exons and their flanking introns regions for (a) low expressed genes and (b) high expressed genes. In each category the distribution of DNA methylation rates is shown for hypomethylated (left) and methylated (right) exons. (c) Examples of the methylation rates at exons and their flanking regions are shown for KIAA0746 and MAD1L1, a low expressed and a high expressed gene, respectively, possessing a hypomethylated exons adjacent to a methylated exon. The average methylation rates at the exons and their 200 bp flanking regions are indicated.