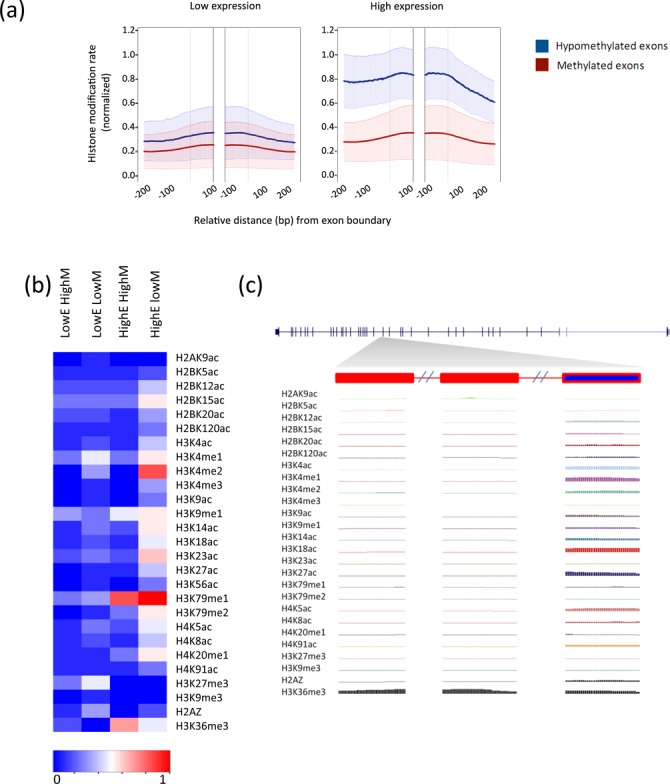
Figure 5.

Expressed and hypomethylated exons are significantly enriched with histone modifications. (a) Normalized histone modification densities at the bottom 20th percentile of expression (left) and the top 20-th percentile of expression (right). Bold lines mark averages across the 28 measured histone modifications for the hypomethylated (blue) and methylated (red) exons sets. Shaded regions mark one standard deviation. (b) A heatmap summarizing the average density for each of the analyzed histone modifications (rows) in the four different sets (columns): methylated exons in low expressed genes, (LowE HighM), hypomethylated exons in low expressed genes (LowE LowM), methylated exons in highly expressed genes (HighE HighM) and hypomethylated exons in highly expressed genes (HighE LowM). (c) Density of the different histone modifications at three exons of the highly expressed LAMA4 gene. The left and middle exons are methylated and the right exon is hypomethylated.
