
Figure 4.
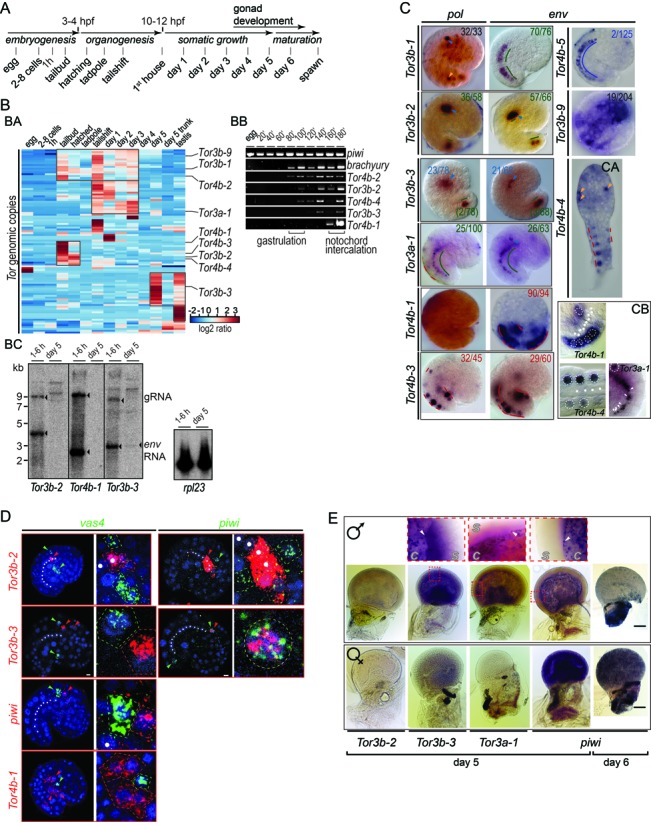
Expression of Tor during development. (A) Schematic representation of the Oikopleura life cycle. (B) Tor expression in Oikopleura cDNA collected at different stages. (BA) The heat map represents variation of Tor expression as shown by cDNA hybridization on genomic tiling arrays. Hierarchical clustering reveals five groups of elements with similar expression, highlighted with squares on the heat map. (BB) RT-PCR profiling of piwi, brachyury and Tor env within 3 h pf. (BC) Northern blots performed with antisense env probes show Tor expression in poly-A+ RNA extracted either from embryos or from day 5 animals. The housekeeping gene rpl23 was used as a loading control. (C) WISH samples stained with NBT/BCIP show gene expression patterns obtained with antisense pol and env probes. Animals were collected at the tailbud stage or after hatching (CA). Yellow and blue arrows mark uncharacterized cells present in the epiderm and mesenchyme, respectively. Lines highlight positive cells in the notochord (green), tail muscle (red) and tail nerve chord (blue). The proportion of samples showing the same pattern is indicated. (CB) shows a magnified view of env signal in the tail. Dotted circles, muscle cell nuclei; white dots and arrows, notochord cell nuclei. (D) Double fluorescent WISH showing expression of Tor, vas4 and piwi. Samples were collected at 160 min pf for Tor4b-1 and at 180 min pf for the other probes. Probes were labelled with FITC (green) or Cy5 (red) and nuclei were stained with DAPI (blue). Arrows mark positive cells. Magnifications show signals in neighbouring cells or in the same cell for Tor3b-3 (yellow dotted circle). Scale bar, 5 μm. (E) WISH samples showing expression of piwi and env in day 5 and 6 animals: males (top), females (bottom). Magnification of the testis (top row) reveals follicular cells (arrows) present in day 5 animals at the interface between the gonad cavity (c) and the syncytium (s). Scale bar, 200 μm.