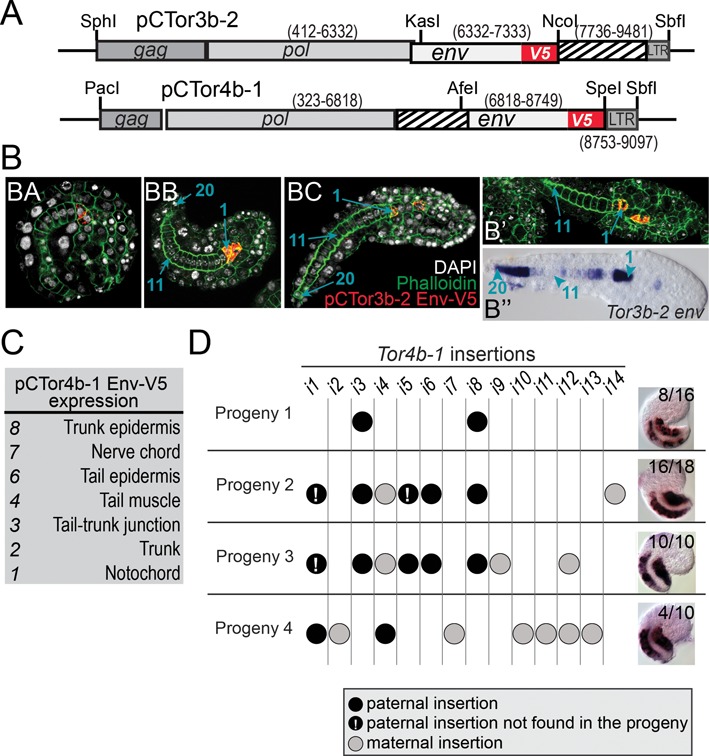
Figure 6.

Autonomous expression of Torgenes. (A) Schematic representations of the expression constructs tested in Oikopleuraembryos. The numbers indicate coordinates on TorDNA, striped boxes represent non-coding sequences. (B) pCTor3b-2 drives Env expression in the anterior cells of the notochord. (BA), embryo before hatching; (BB) and (BC), embryos after hatching showing a complete notochord with 20 cells (blue arrows); (B’) and (B’’)), comparison of pCTor3b-2 activity with the expression pattern of Tor3b-2 env in wild-type embryos. (C) pCTor4b-1 expresses Env in various tissues. The table indicates the number of positive embryos showing expression in the same tissue (Supplementary Figure S7A). (D) Tor4b-1 copies and their envexpression pattern. The table shows the presence of insertions i1 to i14 in F1 animals from individual crosses. Segregation in the progeny was followed using Southern blotting (Supplementary Figure S7B). On the right, micrographs show WISH patterns obtained in the progeny using the antisense Tor4b-1 env probe. Numbers indicate signal frequency.
