
Figure 4.
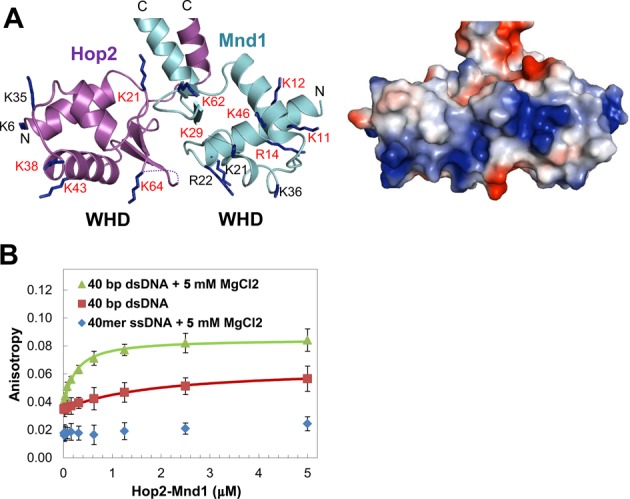
Interaction between the WHDs and DNA. (A) Basic patches across the WHDs. A ribbon drawing of the WHDs (left) and an electrostatic surface potential representation (right) are shown side by side. The basic residues are shown in sticks and conserved residues are labeled with red letters. Lys61 of Hop2 which is on the disordered wing is not included. (B) DNA binding of Hop2–Mnd1. Fluorescence anisotropy measurement was performed in triplicate by titrating Hop2–Mnd1 into fluorescein-labeled DNA (50 nM).