
Figure 5.
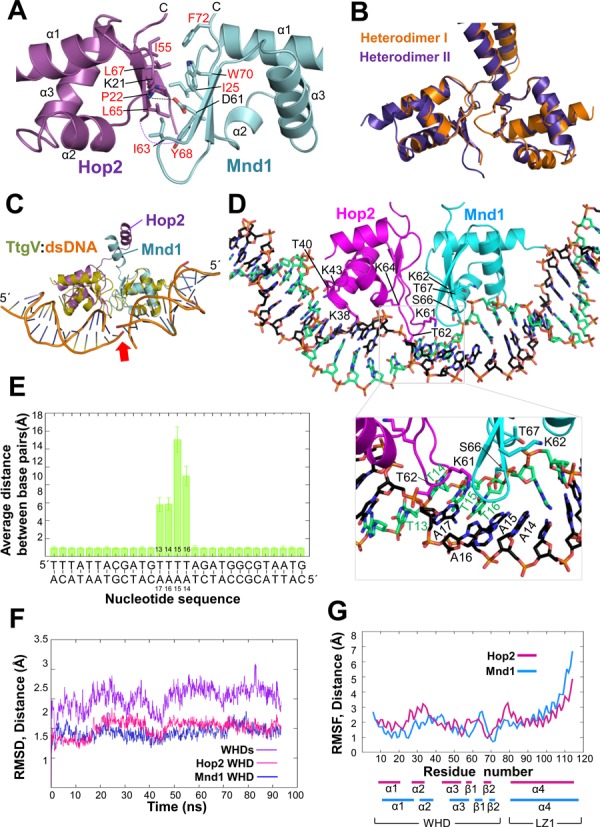
Juxtaposed WHDs and a model for dsDNA binding. (A) The interface between the WHDs is mostly hydrophobic. The residues at the interface are shown in sticks, with the hydrophobic residues labeled in red. The view is to look down from LZ1. (B) Superposition of the WHD pairs in Heterodimers I and II. The Cα traces were superposed only for Hop2. (C) Superposition of the WHD of TtgV bound to its recognition sequence (PDB entry: 2xro) onto each WHD of Hop2 and Mnd1. The arrow highlights the discontinuity of the DNA duplex. (D) A model for dsDNA binding to the WHD pair. The two dsDNA segments in C were connected to form a single dsDNA. The geometry was refined (see Methods section) and the resulting model is shown with the inset highlighting the observed dissociation of base pairs during ∼94 ns of MD simulation. Only the WHDs and LZ1 are included in the simulation. The view is to look down from LZ1. (E) MD-averaged base-pairing distances during ∼94 ns of MD simulation. Large deviations from canonical base-pairing geometries take place in the middle segment of dsDNA. (F) RMSDs between the crystal structure reference and each individual WHD and their heterodimer during the MD simulation time. RMSDs were calculated for all atoms. (G) RMSFs per residue during the simulation time. Much smaller fluctuation of the WHDs in comparison with LZ1 is noted. RMSFs were calculated for the Cα atoms only.