
Figure 3.
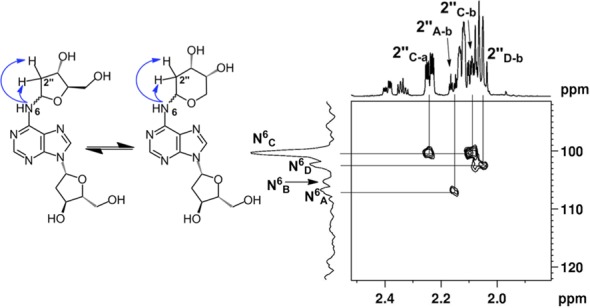
15N-HMBC data showing the H2″ spectral region of compound 6. The correlations between N6 of dA and H2″ of dR can be seen by contours shown at the intersecting lines between signals for the N6 and H2″ protons, indicating a two to three-bond coupling between these atoms.