
Figure 7.
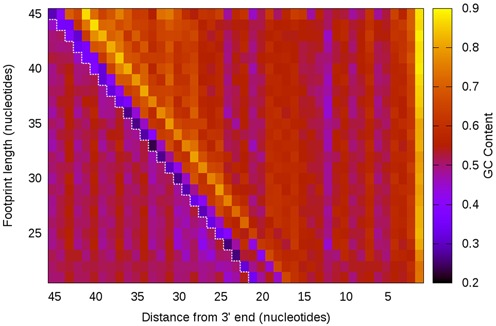
GC content analysis of Escherichia coli ribosome footprints. Footprints were categorized by length and each nucleotide position was measured for its average GC content across all footprints. Shorter footprints were extended to the 5′ end, revealing what the mRNA sequence was prior to nuclease digestion (red dashed line). We see that the 5′ and 3′ ends of footprints, regardless of length, have some strong GC biases. Furthermore, the longer footprints have increasingly high GC content downstream from the 5′ end.