
Figure 8.
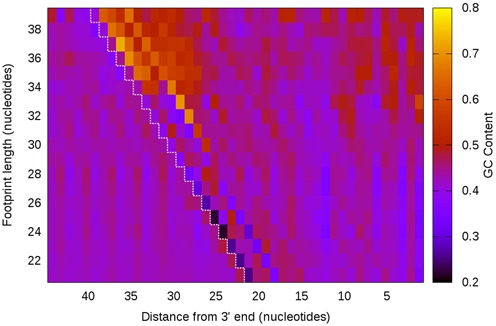
GC content analysis of yeast ribosome footprints.The yeast genome has a lower GC content than the Escherichia coli, as visible by the cooler colors. Nevertheless, we observe, as in E. coli, sequence biases at the ends of the footprints as well as a length-dependent increase in GC content downstream from the 5′ end.