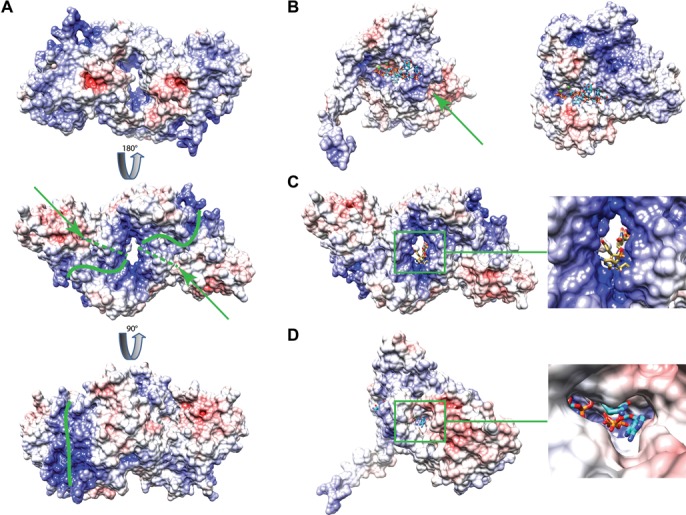
Figure 5.

Electrostatic surface representation of the Mg561 protein. (A) Electrostatic surface of the Mg561 dimer. The green lines correspond to the possible RNA binding sites in the positively charged grooves (blue). The green arrows point the position of the second tunnel and the dashed lines delineate the tunnel path under the surface. Contour levels: red, V < −10 kcal/mol; white, −10 kcal/mol < V < +10 kcal/mol; blue, V > +10 kcal/mol. (B) Proposed mimiviruses PAP RNA and ATP binding mode (left panel, Mg561 monomer) based on the superimposition of the VP55 complex with ATP and RNA (PDB 3ERC) on Mg561 (right panel). Predicted cation sites are marked as green balls. (C) As in (B) but with the Mg561 dimer (left panel). Close-up of the central tunnel (right panel). (D) Proposed ATP entry route pointed by the green arrow (left panel). Close-up of the tunnel through the ATP binding site (right panel).
