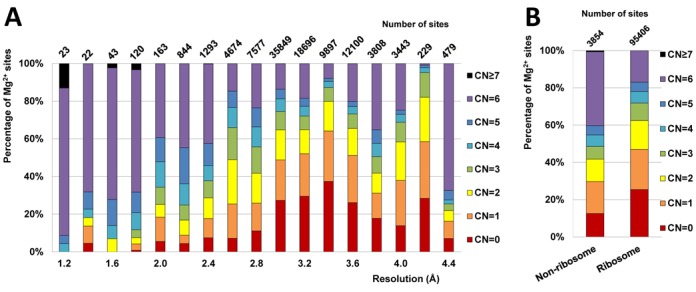
Figure 1.

Statistics for the coordination number (CN) of Mg2+ sites in the full dataset. (A) Fraction of different CN for Mg2+ sites from structures in different resolution ranges shown as stacked bars. The total numbers of Mg2+ sites for each resolution range are shown on top of each bar. (B) Percentages of Mg2+ sites in either the ribosome or non-ribosome subset with a given CN.
