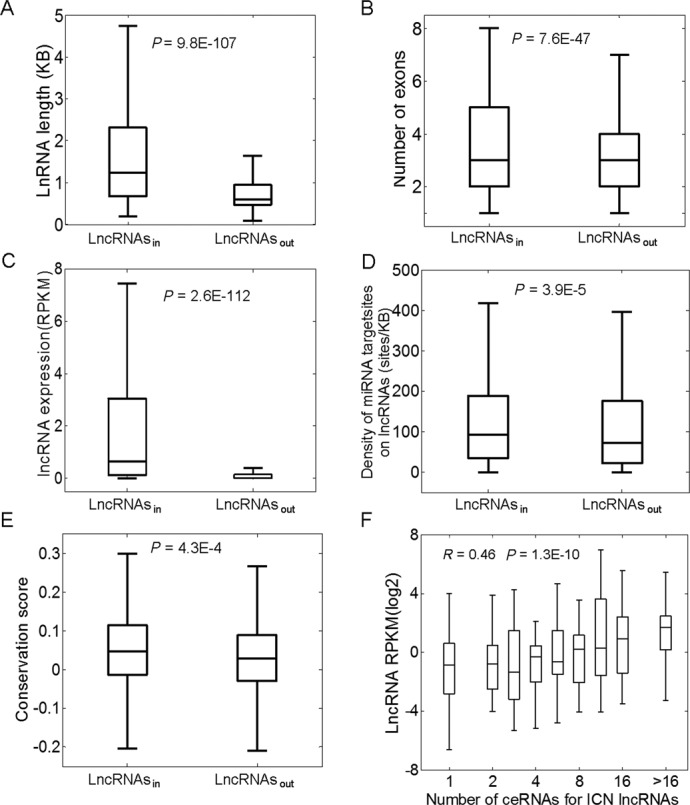
Figure 3.

LncRNAsin have more extreme properties than lncRNAsout. In lncRNAsin, (A) transcript length and (B) number of exons was greater; and (C) expression levels (RPKM), (D) miRNA target site density (sites/KB) and (E) conservation scores were higher than in lncRNAsout. (F) Expression levels of lncRNAs in lncACTs were positively correlated with the number of associated lncACTs. Boxplots depict different groups of properties. From bottom to top in each boxplot, the five vertical lines represent the minimum observed value (Min), the first quartile (Q1), the second quartile (Q2) or median, the third quartile (Q3) and the maximum observed value (Max). P values were determined by the Mann-Whitney U test.
