
Figure 4.
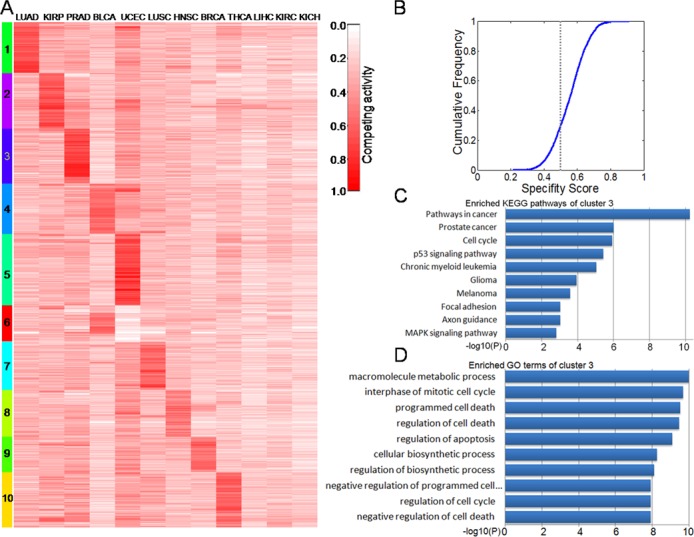
(A) Dynamic changes in activity profiles of lncACTs (rows) in 12 types of cancer (columns). Rows were ordered by a k-means clustering of lncACTs; 10 lncACT clusters had high activity levels in one or two cancers. These clusters comprised of approximately 83% of the 5119 functional lncACTs that were analyzed. Competing activity is indicated by a red colored bar, ranging from 0 to 1. (B) Cumulative distribution of lncACT specificity score. The majority (>70%) of lncACTs had scores of >0.5. The X axis represents the specificity score for each lncACT. The Y axis represents the cumulative frequency of specificity score. (C and D) KEGG pathways and GO terms enriched for lncACT cluster 3, ranked by −log10(P).