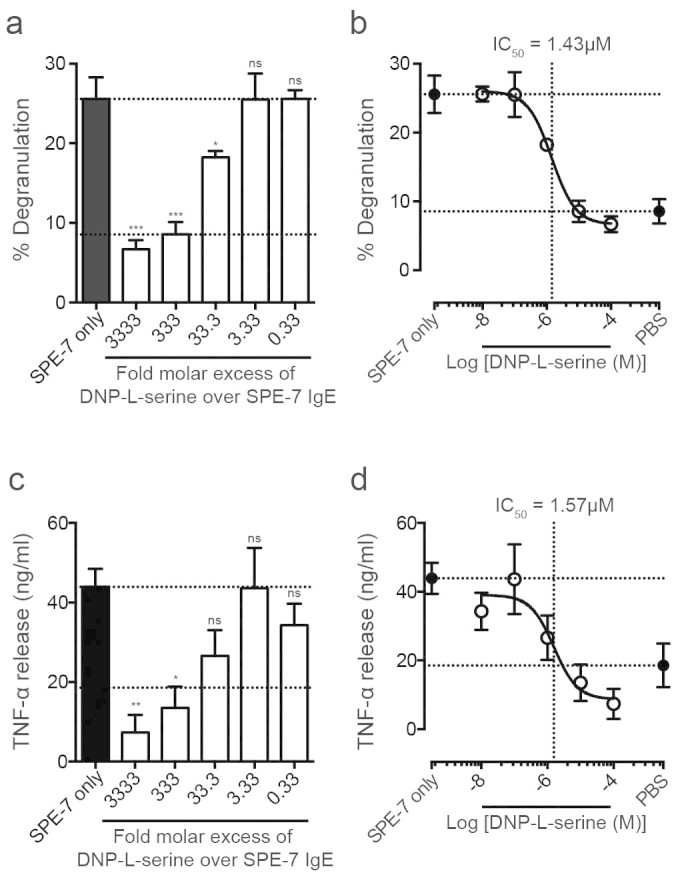
Figure 2. Monovalent DNP inhibits SPE-7 IgE induced LAD-2 cell activation.

(A) Percentage degranulation of LAD-2 cells, induced by 30 nM SPE-7 IgE, was dose-dependently inhibited by addition of indicated molar excess of monovalent DNP-L-serine. (B) Data are represented as an inhibition curve. IC50 of monovalent DNP-L-serine inhibition of SPE-7 IgE induced degranulation = 1.43 μM. (C) LAD-2 cell TNF-α release, induced by 30 nM SPE-7 IgE, was dose-dependently inhibited by addition of indicated molar excess of monovalent DNP-L-serine. (D) IC50 of monovalent DNP-L-serine inhibition of SPE-7 IgE induced TNF-α release = 1.57 μM. Lower and upper dashed lines indicate cell-only background control and activation by SPE-7 IgE only, respectively. Means of 3 to 7 independent experiments ± SEM are shown. Statistically significant difference to SPE-7 IgE only was determined by one-way ANOVA with Dunnett's post-test; *** p < 0.001, ** p = 0.001 to 0.01, * p = 0.01 to 0.05, ns = not significant p ≥ 0.05.
