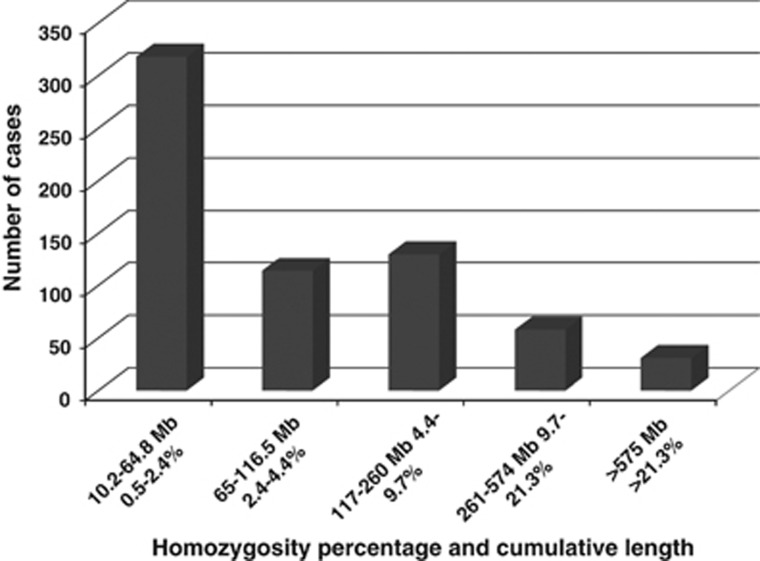
Figure 2.
Total number of cases in each of the five inbreeding groups. The X axis represents the homozygosity percentage values and the corresponding cumulative length for the five groups (95% confidence interval). The Y axis represents the total number of cases in each group (Table 1a).

