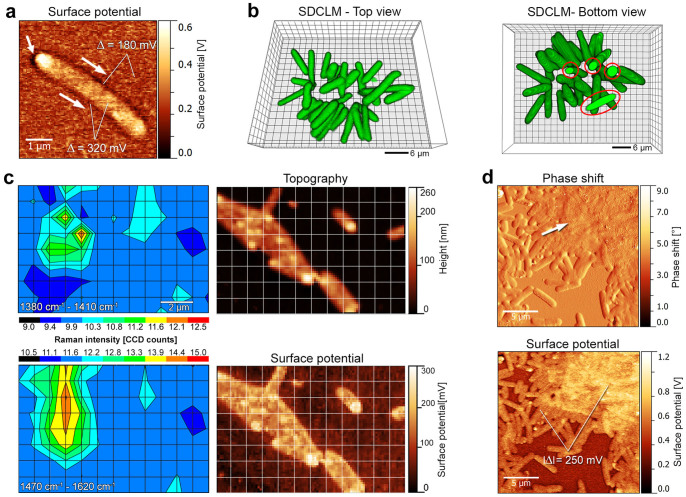
Figure 2. Aggregation of bacterial cells and formation of capsular TB-EPS and cell-cluster enveloping LB-EPS.
(a) Capsular, TB-EPS shape observable by surface potential changes in close proximity of the bacterial membrane. (b) Ex-vivo SDCLM data of a small bacterial cluster mediated by cell-cell adhesion. The bottom view of the bacterial aggregate demonstrates a small amount of surface-adhered cells (red circles) as bacterial cluster anchorage. (c) Confocal Raman intensity data and complementary SPM data of the same sample reveal the presence of polysaccharides (Raman interval 1380 cm−1–1410 cm−1) and EPS matrix compounds (Raman interval 1470 cm−1–1620 cm−1). (d) The formation of secondary LB-EPS covering a bacterial cluster can be identified via SPM by significant changes in phase shift (related to material viscoelasticity) and surface potential. See also Supplementary Fig. S3. Measurement statistics are described in the Materials and Methods section.

