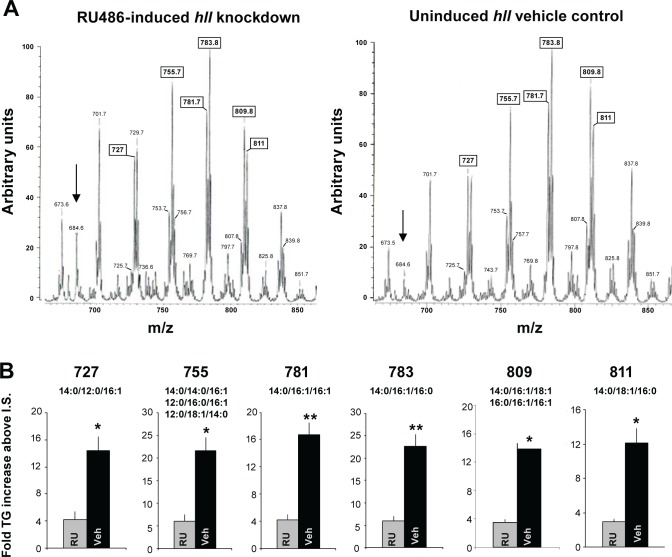
Figure 3.
Triglyceride levels are decreased with ubiquitous hll knockdown. (A) Representative triglyceride profiles from flies with ubiquitous knockdown of hll (tubGS- > UAS-hllRNAi induced by RU486, left tracing) and the uninduced, genetically identical siblings on the vehicle control (veh, right tracing). We chose to use the GeneSwitch system to minimize the number of groups analyzed and to better control for genetic background. Tracings were generated using positive ion electrospray ionization (ESI) mass spectrometric (MS) analyses of lipid Li+ adducts from whole flies. Peaks are labeled by their mass to charge (m/z) ratios, and the boxed m/z values correspond to the peaks quantified in (B). The arrow denotes internal standard (m/z 684), and the most intense peak is normalized to 100. Although there is a decrease in overall triglyceride abundance, there is no change in the distribution of triglyceride molecular species. (B) Quantification of triglyceride peaks from the mass spectra of hll knockdown and the uninduced siblings (four samples per group; n = 5 flies/sample). Numbers above graph represent the m/z value from (A) and the smaller numbers are the lipid species that could correspond to the given m/z value. The intensity of the peak in question was divided by that of the internal standard (I.S.), and the resultant ratio was then normalized to protein content to determine the fold-increase of the triglyceride species represented by the peak. *P < 0.05) or **P < 0.01 as calculated by Student t-test with a Bonferroni correction.

