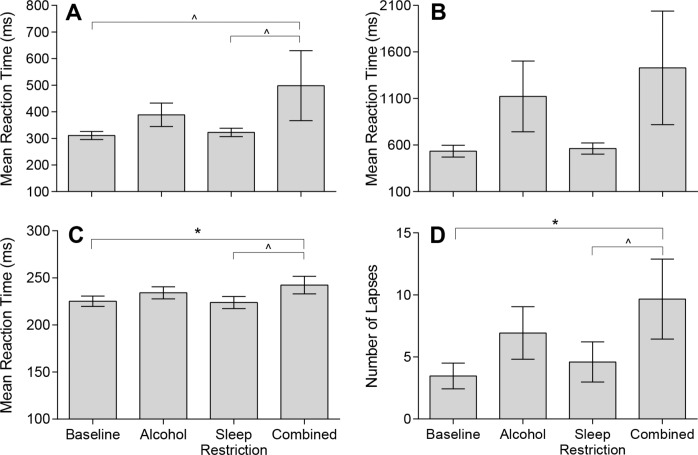
Figure 3.
Mean and standard error of the means for Psychomotor Vigilance Test performance under Baseline (BL), Alcohol (AL), Sleep Restriction (SR), and Combined (C) conditions. These include (A) Mean Reaction Time (BL: 311.0 ± 15.2ms; AL: 388.7 ± 44.1 ms; SR: 322.5 ± 15.8 ms; C: 498.3 ± 131.4 ms); (B) Slowest 10% of reaction times (BL: 533.5 ± 36.3 ms; AL: 1122.1 ± 380.2ms; SR: 562.8 ± 60.4 ms; C: 1429.3 ± 610.1 ms); (C) Fastest 10% of reaction times (BL: 225.2 ± 5.5 ms; AL: 232.2 ± 6.4ms; SR: 223.9 ± 6.4 ms; C: 242.4 ± 9.3ms); and (D) Number of Lapses (BL: 3.5 ± 1.0; AL: 6.9 ± 2.1ms; SR: 4.6 ± 1.6 ms; C: 9.7 ± 3.2 ms). ∧Padj < 0.10; *Padj < 0.05. Untransformed data are plotted.

