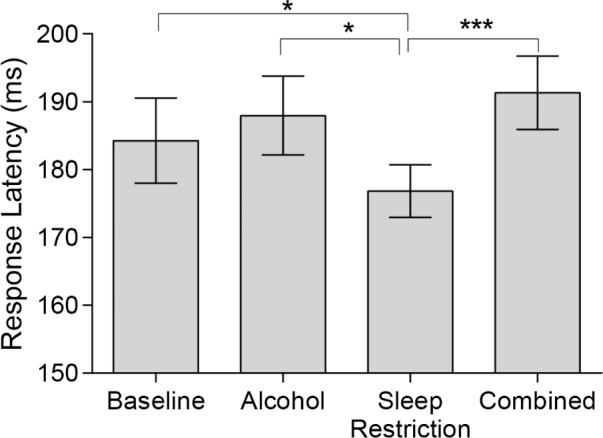
Figure 6.

Mean ± standard error of the mean for response latency on the visually guided task for all conditions. (Baseline: 185.4 ± 6.2 ms; Alcohol: 189.0 ± 5.7 ms; Sleep Restriction: 177.7 ± 3.9 ms; Combined: 191.7 ± 5.7ms). *Padj < 0.05; ***Padj < 0.001. Untransformed data are plotted.
