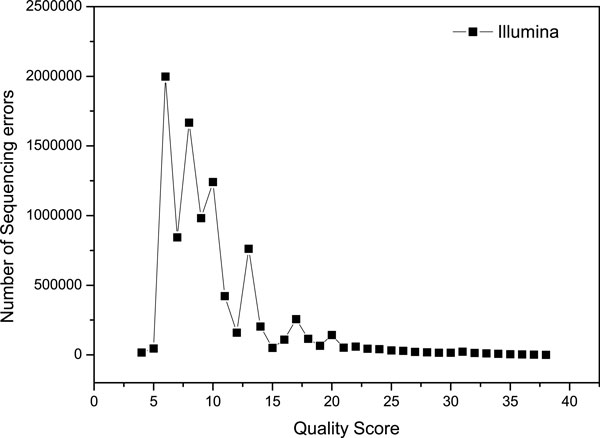
Figure 1.

The quality score distribution of sequencing errors. The 10 million reads of Illumina's Solexa with length 50-bp simulated by ART, and each base in a read is assigned a quality score by a phred-like algorithm. X represents the quality scores ranging from 0 to 40, and Y represents the number of sequencing error corresponding for each X value.
