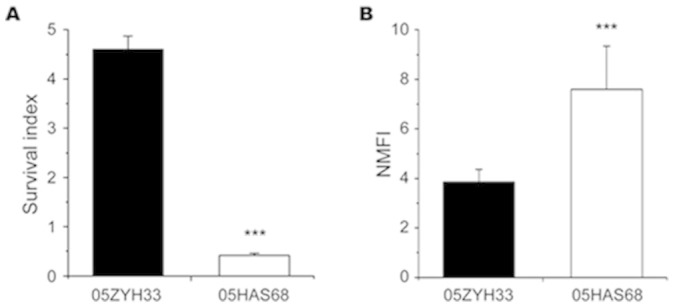
Figure 4. Whole blood killing and bacterial adherence assays.

(A). Whole blood killing assay. Data are expressed as survival index: (CFU bacteria at end of assay)/(initial bacteria CFU) with the mean ± SD of three independent experiments. (B). Comparison of bacterial adherence capability between 05HAS68 and 05ZYH33. The normalized mean fluorescence intensities (NMFI) of the cells are shown as columns with the mean ± SD of intracellular bacteria/ml. ***P < 0.001.
