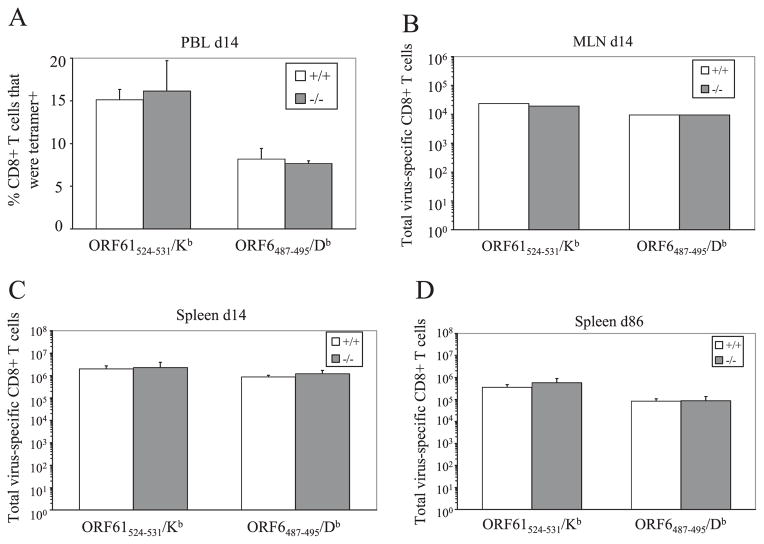
FIGURE 3.
The magnitude of the virus-specific CD8+ T cell response is 4-1BBL independent. CD8+ T cells specific for the ORF61524–531/Kb and ORF6487–495/Db epitopes in the peripheral blood (A), MLN (B), and spleen (C and D) were quantified at indicated time points by MHC/tetramer staining. The percentage (A), or the total number (B–D), of CD8+ T cells specific for each epitope are graphed (error bars indicate SD). MLN were pooled for each group. Representative data from two independent experiments with three to four mice per group are shown.

