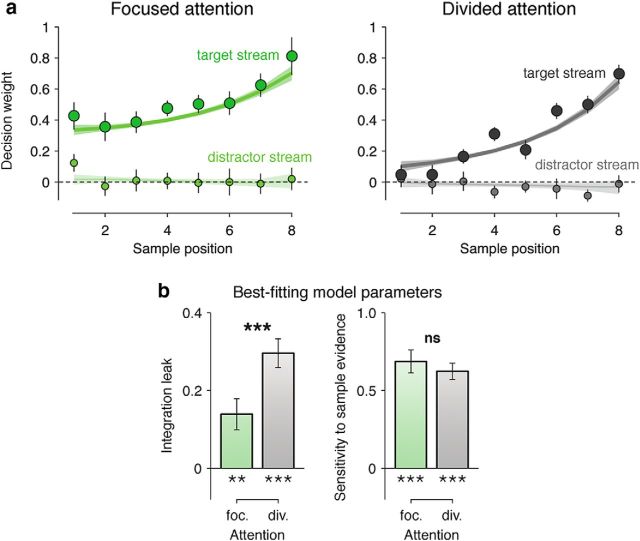
Figure 2.
Human behavior. a, Decision weighting profiles across the eight samples, sorted by their position in the stream, for target (large dots) and distractor (small dots) streams in the focused (left) and divided (right) attention conditions. Dots and attached error bars indicate the human data (mean ± SEM). Lines and shaded error bars indicate the predictions of the best-fitting model. b, Best-fitting model parameters in the focused (left bar) and divided (right bar) attention conditions. Left, Integration leak. Right, Sensitivity to sample information. Conventions are the same as in a. **p < 0.01, ***p < 0.001. ns, Nonsignificant effect.

