
Figure 8.
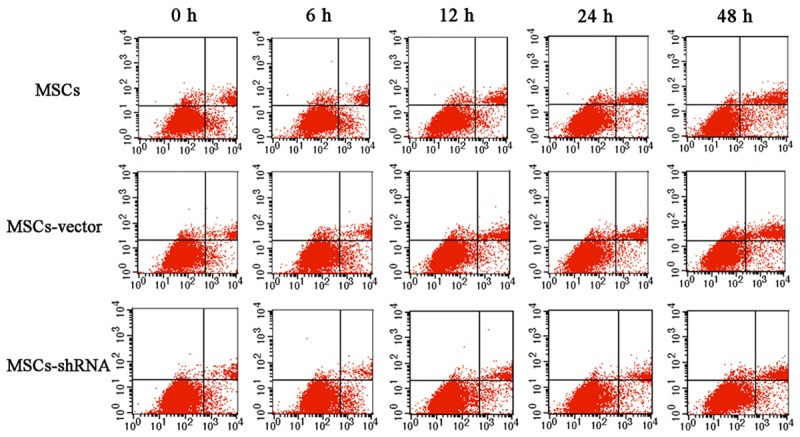
Scatter diagram of MSC apoptosis. The apoptosis rates measured by annexin V-APC/PI double staining at 0, 6, 12, 24, and 48 h of hypoxia.
Official websites use .gov
A
.gov website belongs to an official
government organization in the United States.
Secure .gov websites use HTTPS
A lock (
) or https:// means you've safely
connected to the .gov website. Share sensitive
information only on official, secure websites.
Scatter diagram of MSC apoptosis. The apoptosis rates measured by annexin V-APC/PI double staining at 0, 6, 12, 24, and 48 h of hypoxia.