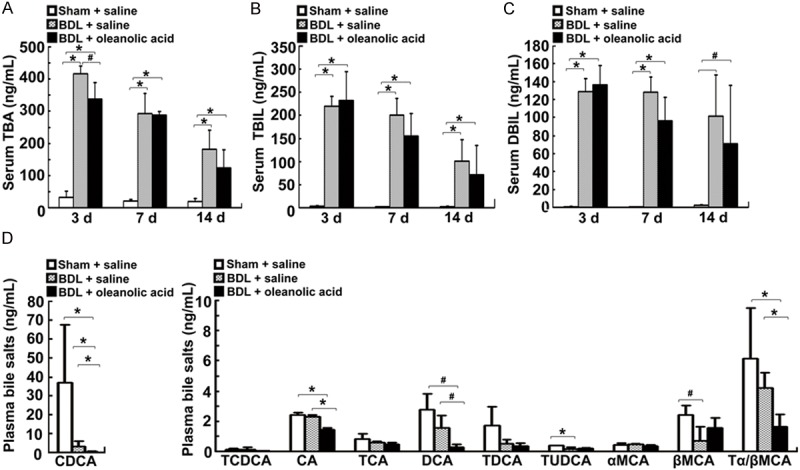
Figure 3.

Changes in serum biochemistry and bile salt levels in the BDL rats -treated with oleanolic acid. The animals were treated as described in Figure 2. Levels of TBA (A), TBIL (B), and DBIL (C) on days 3, 7 and 14. (D) Serum levels of bile salts CDCA, TCDCA, CA, TCA, DCA, TDCA, TUDCA, Tα/βMCA, αMCA, and βMCA on day 3. Data are expressed as mean ± SD (n = 7 rats per group). *P < 0.01 vs sham operated rats or the BDL model rats-treated with saline, #P < 0.05 vs sham operated rats or the BDL model rats-treated with saline.
