
Figure 6.
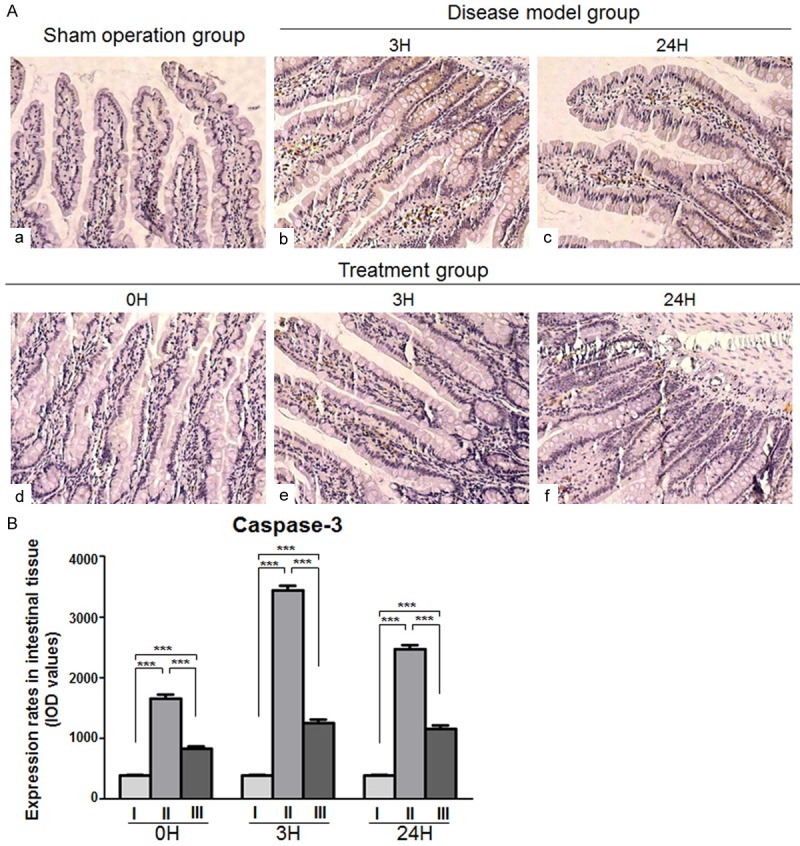
Caspase-3 expression in intestinal mucosal tissues. A. Representative images of immunohistochemical caspase-3 protein expression staining in intestinal tissues. (a) Sham-operated group (b, c) Disease-model group (d, e, f) Treatment group (Magnification × 200). B. Chart of values derived from immunohistochemical caspase-3 protein expression staining in intestinal tissues of (I) the sham operated, (II) the disease model and (III) the treatment animals at the indicated time points (***P < 0.001).