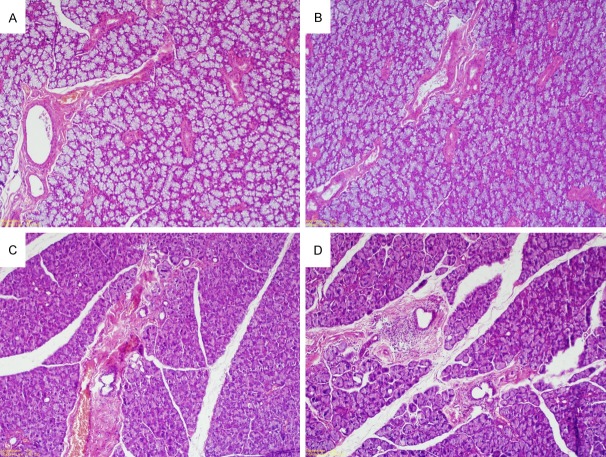
Figure 2.
Mandibular and parotid gland histology of rats. A: Control group rats with normal mandibular histology (Hematoxylin-eosin (H&E), × 100). B: Oxymetazoline group rats with normal mandibular histology (H&E, × 100). C and D: Focal inflammation and minimal periductal inflammation in the rats’ parotid gland administered with oxymetazoline (H&E, × 100).

