
Figure 1.
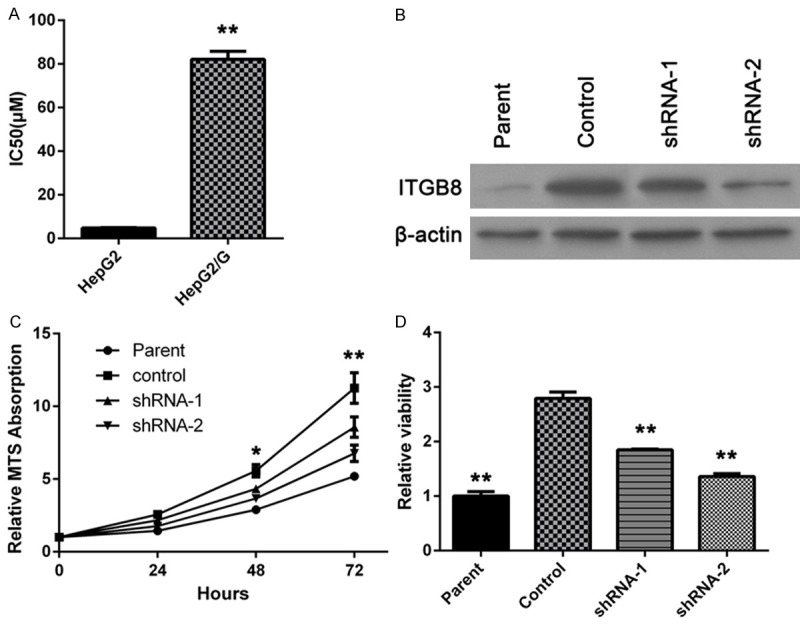
ITGB8 up-regulates in HepG2/G cells and participates in gefitinib resistance. A: Gefitinib IC50 of HepG2 and HepG2/G cells was determined. The data are shown as the means ± SD (n = 3). B: HepG2/G cells were infected with two different ITGB8 shRNAs (shRNA-1 or shRNA-2). Then ITGB8 expression was determined by western blot assay. C: Growth curve of HepG2 cells (Parent), HepG2/G cells (Control) and HepG2/G cells infected with shRNA-1 (shRNA-1) or shRNA-2 (shRNA-2) was determined by MTS assay. D: Cells treated with gefitinib for 72 hours, then cell viability was examined by MTS assay. The data are shown as the means ± SD (n = 3). *P < 0.05, **P < 0.01.