
Figure 5.
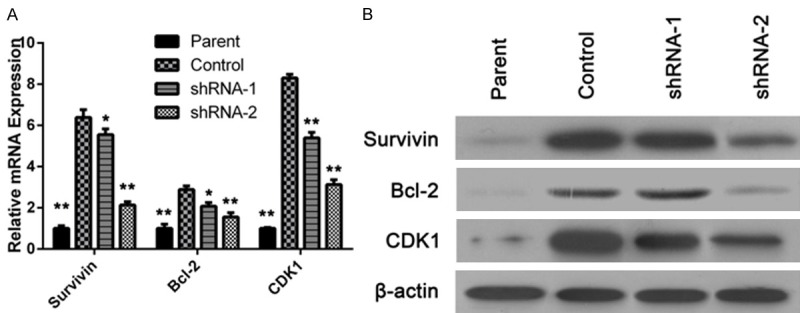
ITGB8 modulated the expression of Survivin, Bcl-2, and CDK1. A and B: qPCR and Western blot analysis of Survivin, Bcl-2, and CDK1 levels in HepG2 cells (Parent), HepG2/G cells (Control) and HepG2/G cells infected with shRNA-1 (shRNA-1) or shRNA-2 (shRNA-2). The data are shown as the means ± SD. *P < 0.05, **P < 0.01.