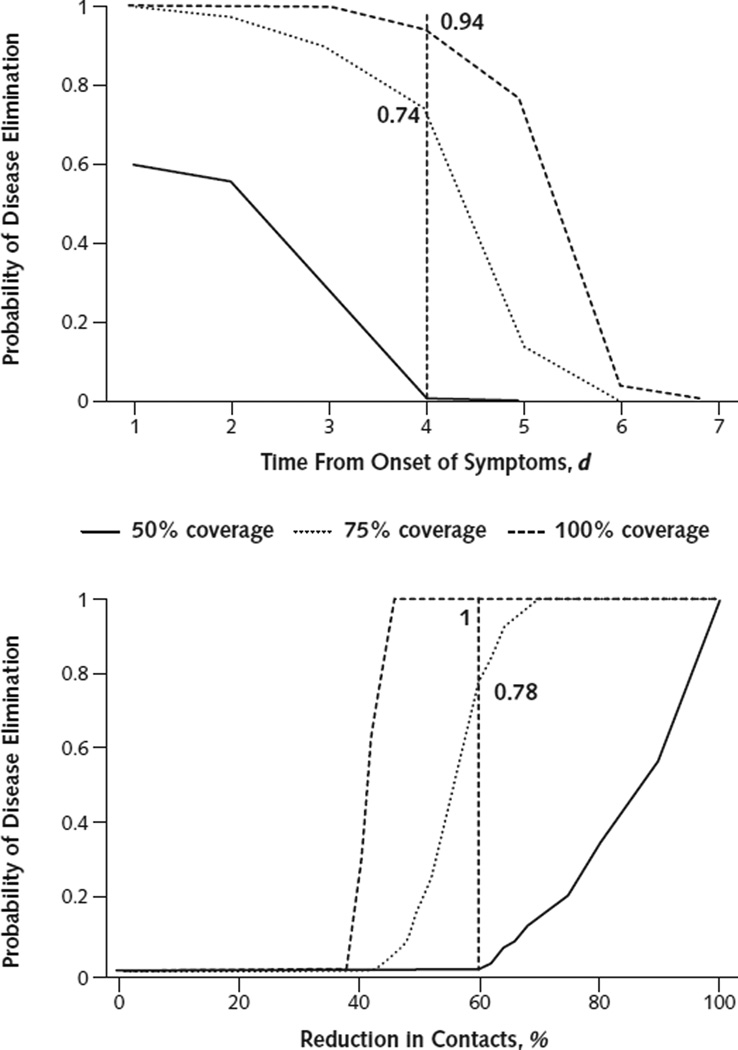
Figure 2.
Probability of disease elimination for different intervention strategies and coverages.
Top. Case isolation of nonsurvivors after symptom onset. Vertical dashed line indicates probability of disease elimination by isolating nonsurvivors within 4 days of symptom onset. Bottom. Percentage self-quarantine on first day of symptom onset. Vertical dashed line indicates probability of disease elimination achieved by a 60% reduction in contacts.

