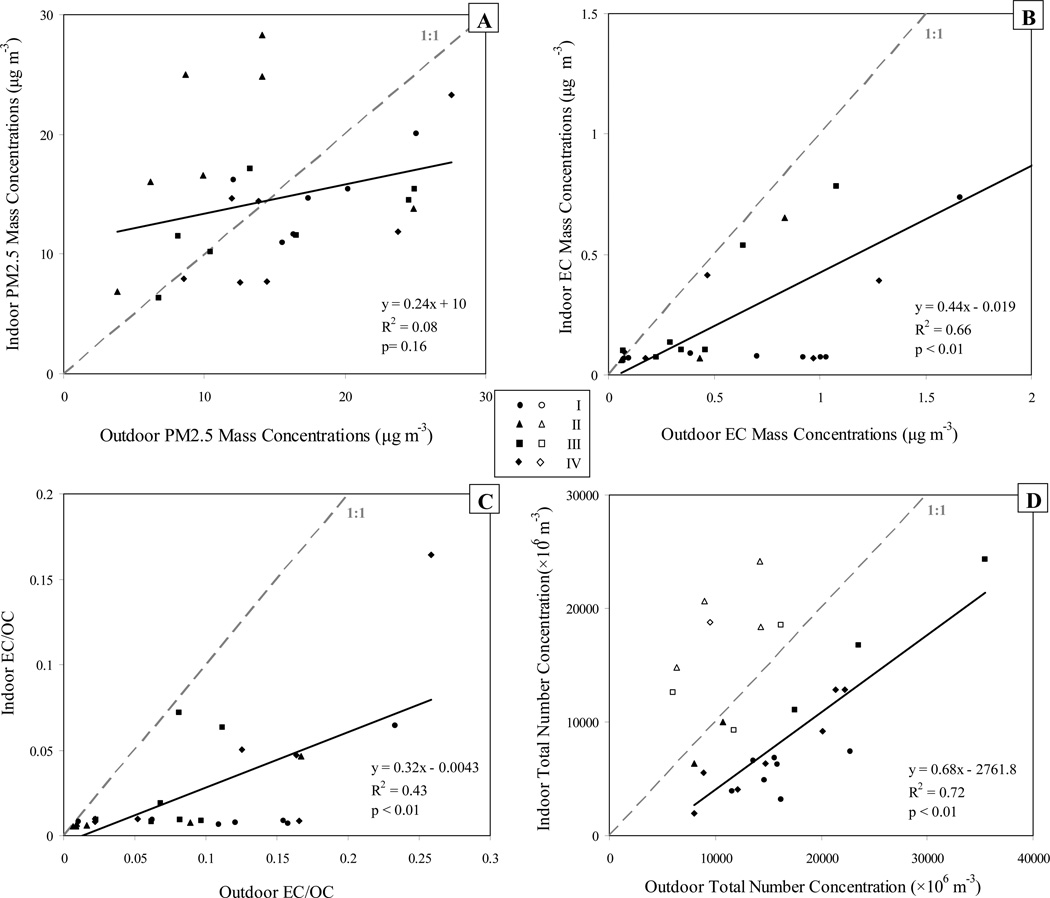
Figure 5.
Relationships between the indoor and outdoor aerosols in terms of PM2.5, EC, EC/OC, and the total number concentration of particles. Each point represents a daily TWA measurement. Linear regression and p-values were calculated for all monitoring days, except in figure D, where days with non-routine activities (hollow symbols) were excluded from the regression analysis. A dotted line corresponds to 1:1 ratio.

