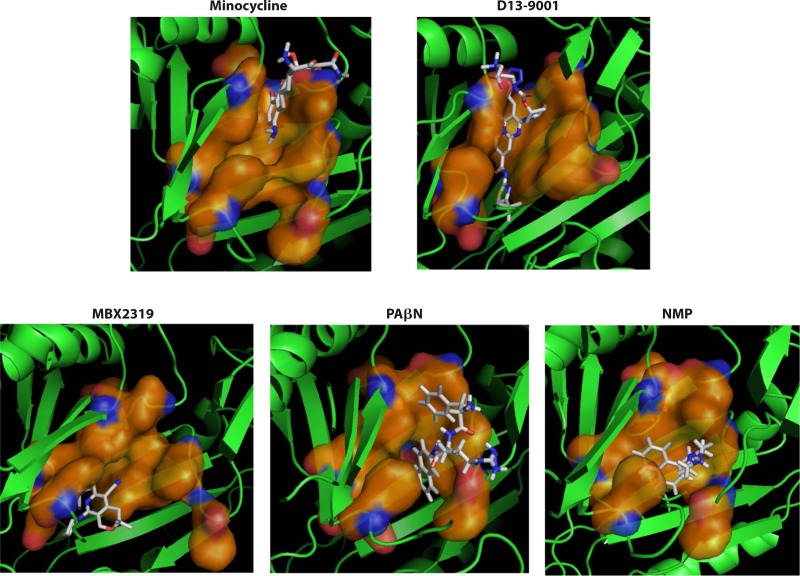
FIG 8.
Binding of various inhibitors determined by MD simulation. Although the binding of PAβN and NMP was examined previously (93), the simulation process was extended to >300 ns. The orange surface shows the distal binding pocket (defined previously [91]), and the inhibitor molecules are shown in sticks with CPK colors. AcrB is shown in green cartoon models, and the part closer to the viewer was removed for clarity. This figure was drawn by using the program Pymol, on the basis of data reported previously (96).

