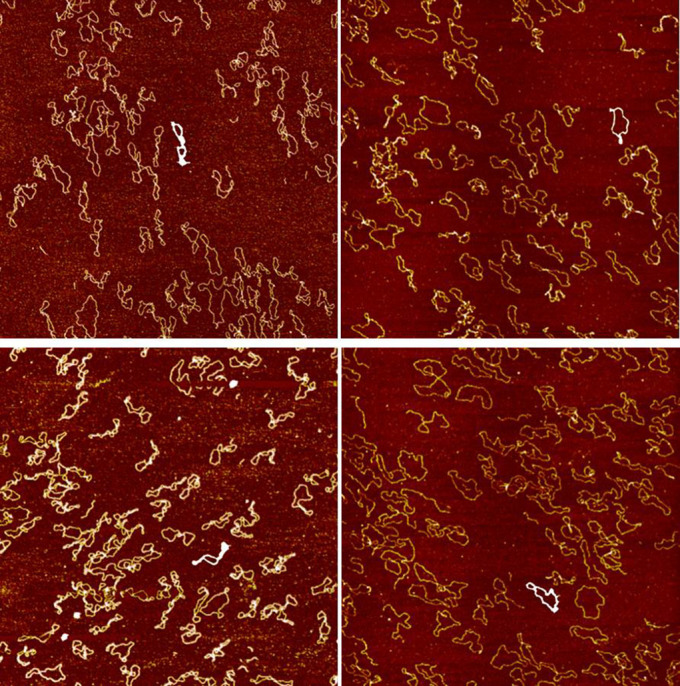
Figure 3. Representative sample of image processed DNA images for the follow up experiment.

TOP LEFT: control group (at one hour) with folding index value 135. TOP RIGHT: control group (at one week) with folding index value 175. BOTTOM LEFT: 30-second group (at one hour) with folding index value 206. TOP RIGHT: 30-second group (at one week) with folding index value 121. White contours were the extracted contours of a given ROI using the image processing approach.
