
Figure 1. Anti-BDCA2 mAb inhibits IFNα production by pDCs and induces internalization of BDCA2 on the surface of pDCs.
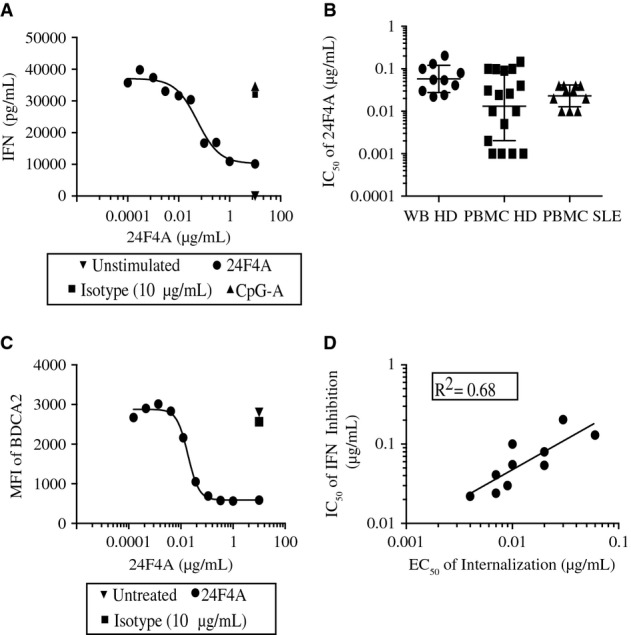
- A, B Whole blood or PBMC were treated with increasing concentrations of 24F4A and stimulated with CpG-A for 16 h at 37°C. Anti-BDCA2-mediated IFNα inhibition in whole-blood assays (A). IFNα levels were detected using human IFNα ELISA. Graph depicts average of duplicate wells of one representative donor (n = 10). IC50 of 24F4A-mediated IFNα inhibition (B) in whole blood (circles) (n = 10) and PBMC (n = 18) from healthy human donors (squares) or SLE patients (triangles) (n = 11). Horizontal bar represents the mean IC50 for each sample type. Error bars represent SD of IC50 between donors.
- C Anti-BDCA2-mediated internalization in whole-blood assays. Whole blood was treated with increasing concentrations of 24F4A for 16 h. Mean fluorescence intensity (MFI) of BDCA2 was determined with a non-cross-blocking anti-BDCA2 mAb (2D6). Shown is a representative plot of 10 experiments conducted.
- D The IC50 of 24F4A-mediated IFNα inhibition was compared to the EC50 of 24F4A-induced BDCA2 internalization.