
Figure 5. Treatment with 24F4A leads to a dose-dependent downmodulation of CD32a on pDCs.
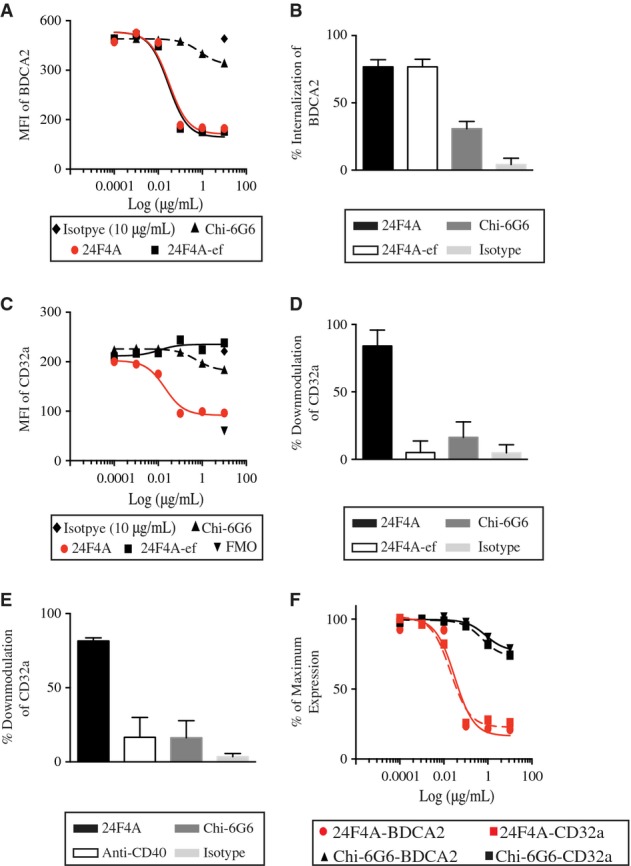
- A–F Isolated pDCs were treated with increasing concentrations of 24F4A (red circles), 24F4A-ef (squares), Chi-6G6 (triangle), or isotype control (diamond) for 16 h at 37°C and stimulated with CpG-A. Flow cytometry was performed to evaluate the MFI of (A) BDCA2 and (C) CD32a on the surface of pDCs. Percent internalization of BDCA2 (B) and CD32a (D) on pDCs treated with 10 μg/ml of 24F4A, 24F4A-ef, Chi-6G6, or isotype control. Error bars represent SD of percent internalization of five experiments conducted. (E) Percent CD32a downmodulation on isolated pDCs treated with 10 μg/ml of an anti-CD40 mAb. Error bars represent SD of percent downmodulation of two independent experiments. FMO represents background staining of CD32a (inverted triangle). (F) Percent of maximal expression of BDCA2 or CD32a in the presence of increasing concentrations of 24F4A or Chi-6G6. Maximal expression was defined by the MFI of both BDCA2 and CD32a on untreated cells. Shown is a representative plot of five independent experiments conducted.