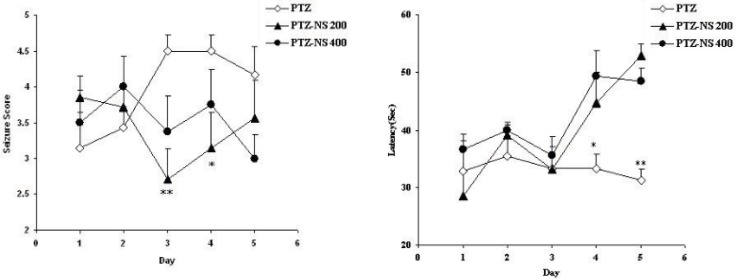
Figure 1.
Comparison of seizure score (A) and latency to the onset of seizures (B) between groups. Data are presented as mean ± SEM (n = 9-10 in each group). *p<0.05 and **p<0.01 compared to PTZ group. The animals were injected by PTZ and observed for 60 minutes. The animals of PTZ- NS 200 and PTZ- NS 400 groups were treated by 200 and 400 mg/Kg of Nigella sativa (NS) extract before PTZ injection. The animals of PTZ group received saline instead of NS extract.

