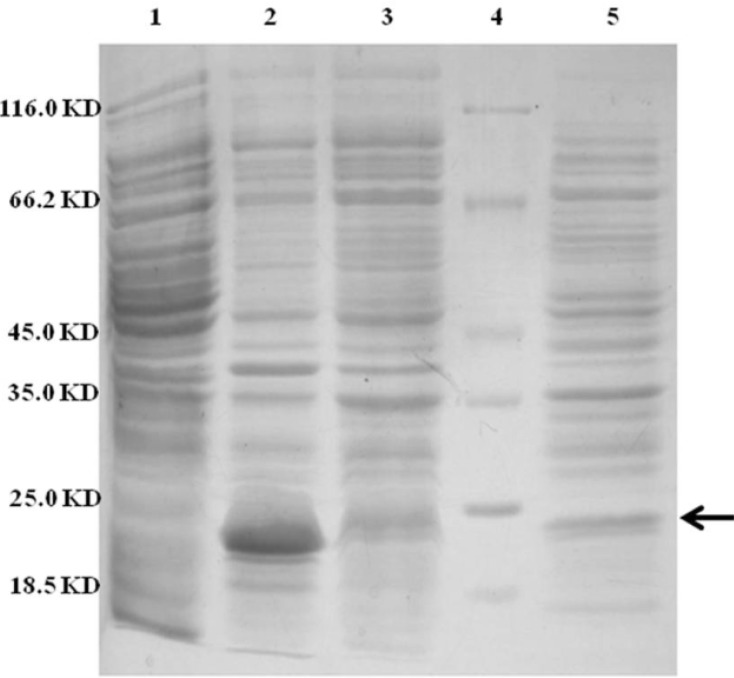
Figure 4.
SDS-PAGE analysis of different cellular fractions of E.coli BL21(DE3) including OmpA-TRAIL. Lane1 and 2: whole cell before and after induction, respectively. Lane 3: cytoplasmic fraction after induction. Lane 4: protein marker. Lane 5: periplasmic fraction after induction. 10 µg of proteins were loaded in each lane.

