Figure 5.

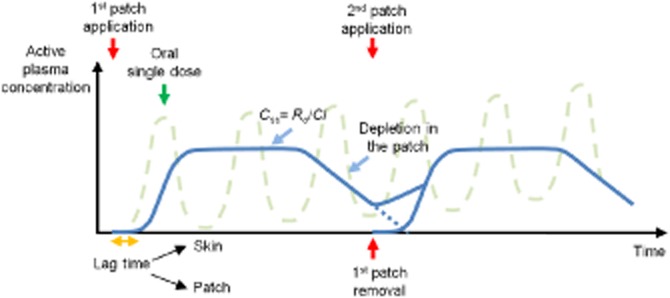
Typical active plasma concentration profile after patch application showing the lag-time, reaching and achieving steady-state, depletion and patch removal as well as the corresponding profile for repeated p.o. dosing of the same active.

Typical active plasma concentration profile after patch application showing the lag-time, reaching and achieving steady-state, depletion and patch removal as well as the corresponding profile for repeated p.o. dosing of the same active.