Figure 5.

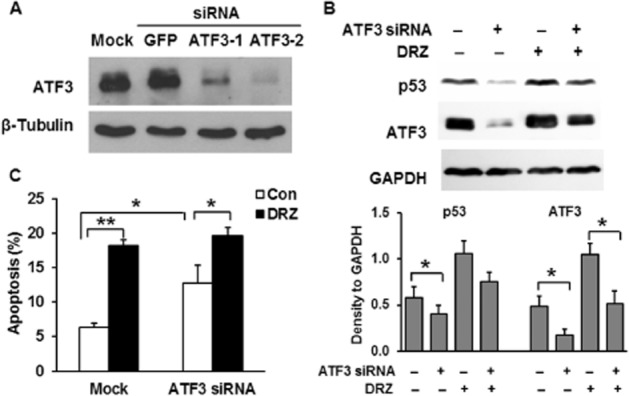
The effect of ATF3 on p53 induction and apoptosis. (A) ATF3 expression 48 h after the transfection with siRNA targeting GFP or two different loci of ATF3 mRNA assessed by Western blot. (B) p53 and ATF3 protein levels assessed by Western blot in TOP2A-expressing HTETOP cells incubated for 24 h with 100 μM dexrazoxane (DRZ) beginning at 24 h after ATF3-2 siRNA transfection. Quantitative data are mean values from three experiments. *P < 0.05, significantly different as indicated. (C) FACS analysis of Annexin V staining in cells pre-treated with or without ATF3-2 siRNA for 24 h followed by exposure to 100 μM dexrazoxane for another 24 h. n = 5, *P < 0.05, **P < 0.01, significantly different as indicated.
