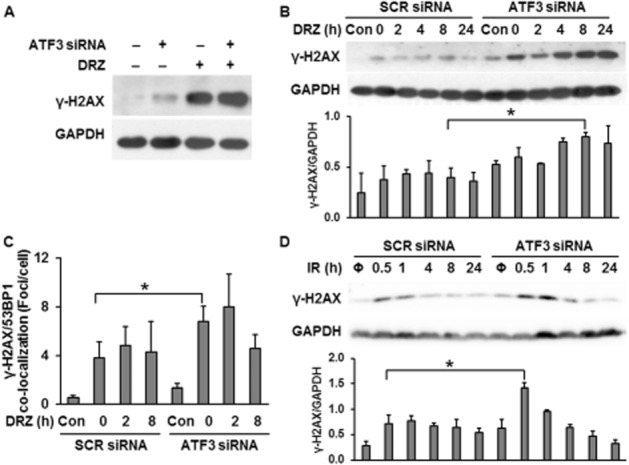
Figure 6.

The effect of ATF3 on DSB formation in TOP2A-expressing HTETOP cells in response to dexrazoxane (DRZ) or IR. (A) γ-H2AX protein levels were assessed by Western blot in TOP2A-expressing HTETOP cells. ATF3 siRNA was transfected 24 h before 100 μM dexrazoxane exposure for 24 h. (B) γ-H2AX levels in scrambled (SCR) or ATF3-2 siRNA-transfected HTETOP cells treated 24 later with 100 μM dexrazoxane for another 24 h. Cells were subsequently washed with PBS, fed with fresh medium and γ-H2AX levels were assessed at the indicated time points after washing. *P < 0.05, significantly different as indicated. (C) The quantification of γ-H2AX/53BP1 foci determined by immunofluorescent staining. The treatment was the same as in (B). n = 3, *P < 0.05, significantly different as indicated. (D) γ-H2AX levels in SCR or ATF3-2 siRNA-transfected cells exposed 24 h later to 10 Gy of IR (Φ: without IR exposure). γ-H2AX levels were determined at the indicated time points after IR exposure. *P < 0.05, significantly different as indicated. All histograms represent mean values from three independent experiments.
