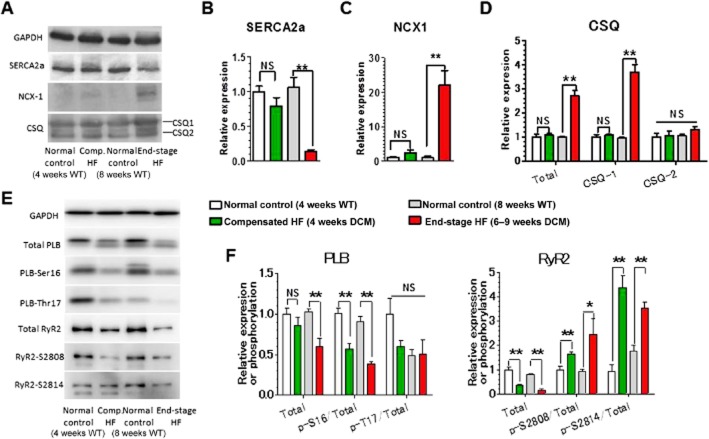
Figure 2.
Up- and down-regulation of expression and phosphorylation of Ca2+ handling proteins in LV myocardium of DCM mice during progression of HF. (A) Representative Western blots of SERCA2a, NCX1, CSQ1 and CSQ2. (B) Relative expression levels of SERCA2a. (C) Relative expression levels of the NCX1. (D) Relative expression levels of CSQ1, CSQ2 and total CSQ. (E) Representative Western blots of PLB and RyR2. (F) Relative expression and phosphorylation levels of PLB and RyR2. *P < 0.05; **P < 0.01; significantly different as indicated; unpaired t-test. n = 5 mice per group except for the end-stage HF group in (F), where n = 4 mice.

