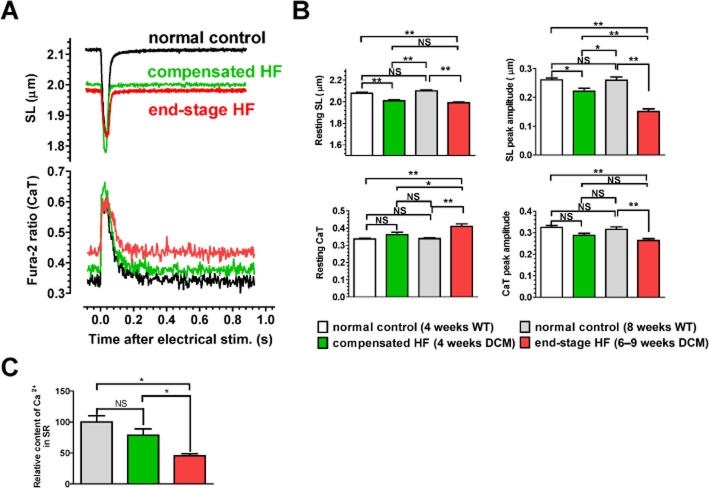
Figure 6.
Pathophysiological changes in cardiomyocytes of DCM mice during progression of HF. (A) Representative SL shortening and CaT in a single cardiomyocyte after electrical stimulation. Normal control, 8-week-old WT. (B) Resting levels and peak amplitudes of SL shortening and CaT. Data were obtained by analysing 24–33 cardiomyocytes isolated (n = 5 hearts per group). (C) SR Ca2+ contents. Data were obtained by analysing five cardiomyocytes isolated from one heart in each group. *P < 0.05; **P < 0.01; significantly different as indicated; one-way anova and post hoc Tukey's multiple comparison.

