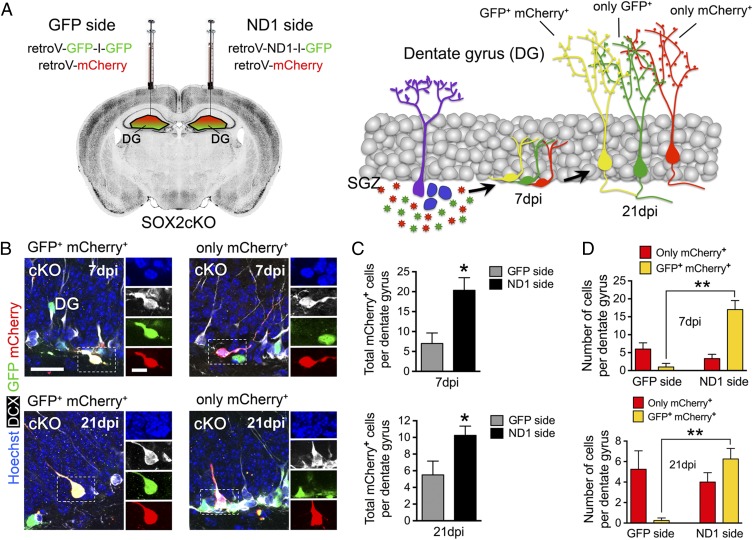
Fig. 6.
NeuroD1 transduction recovers neurogenesis in SOX2cKO mice. (A, Left) Retroviral injections were performed in hippocampal DG of 2-mo-old SOX2cKO mice. One side was injected with a mixture of GFP-IRES-GFP–encoding retrovirus and mCherry-encoding control retrovirus. The other side was injected with a mixture of ND1-IRES-GFP–expressing retrovirus and mCherry-encoding control retrovirus. The same amount of control virus was injected into both sides. (Right) The resulting infected newborn neurons at 7 and 21 dpi. (B) Confocal imaging showing transduced neuroblasts (DCX+) with GFP and mCherry retroviruses (Left) or with only mCherry retrovirus (Right) at 7 and 21 dpi. (Scale bars: 25 µm for merged images and 10 µm for single channels.) (C) Quantification of total mCherry+ (GFP+ mCherry+) and only mCherry+ cells per DG at 7 (Upper) and 21 (Lower) dpi. (D) Quantification of GFP+ mCherry+ and only mCherry+ cells in the GFP and ND1 sides at 7 (Upper) and 21 (Lower) dpi. For all quantifications, data are plotted as the mean ± SEM (*P < 0.05, **P < 0.01).

