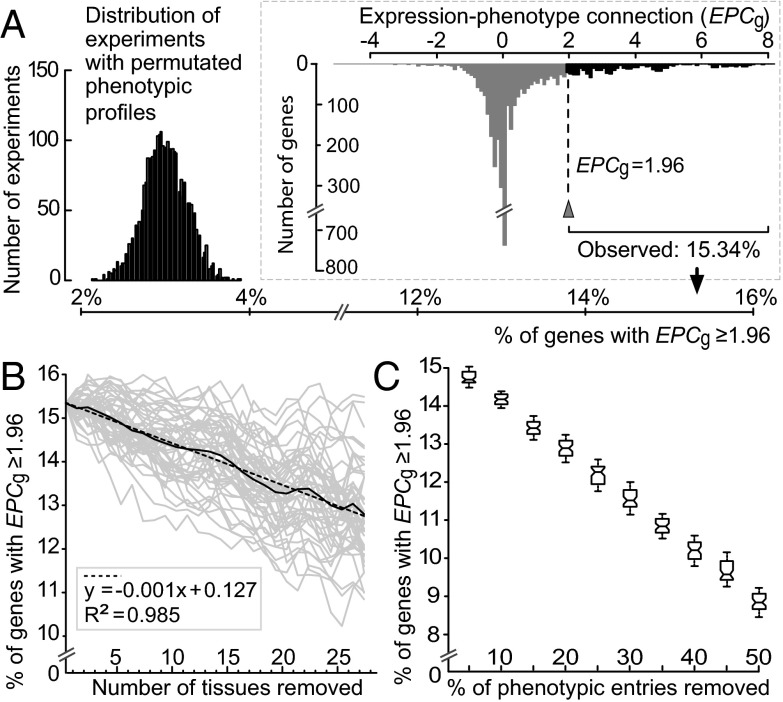
Fig. 1.
EPC at the gene level, measured as EPCg. (A) Percentage of mouse genes with EPCg ≥ 1.96 was 15.34% (arrowhead from the distribution in Inset), which was significantly greater than the percentage of mouse genes with EPCg ≥ 1.96 estimated from permutation experiments. (B) Percentage of mouse genes with EPCg ≥ 1.96 decreased linearly with the number of mouse tissues removed in calculating EPCg. Each gray line is one of 50 experiments derived from the random removal of tissues one at a time. The solid black line is the average of the 50 gray lines. The linear regression line (dashed line with equation given in the gray box) for the average line is given. (C) Box plots for the percentage of mouse genes with EPCg ≥ 1.96 when a proportion of phenotypic entries were removed. Each box presents the distribution of estimations calculated based on 50 replicates. The values of the upper quartile, median, and lower quartile are indicated in each box, whereas the bars outside the box indicate semiquartile ranges.

