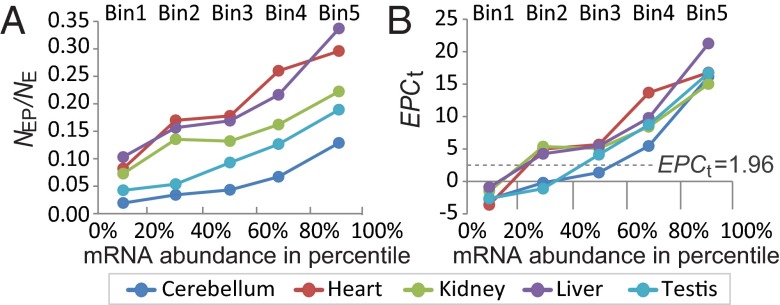
Fig. 3.
Proportion of genes that causes phenotypic abnormalities in the tissue where expressed (NEP/NE) (A) and EPCt values (B) were higher for genes that have higher expression levels, defined by RNA-seq expression signals presented as RPKM. Genes were binned into five equal-sized bins based on mRNA abundance (1–5, lowest to highest) for five tissues.

