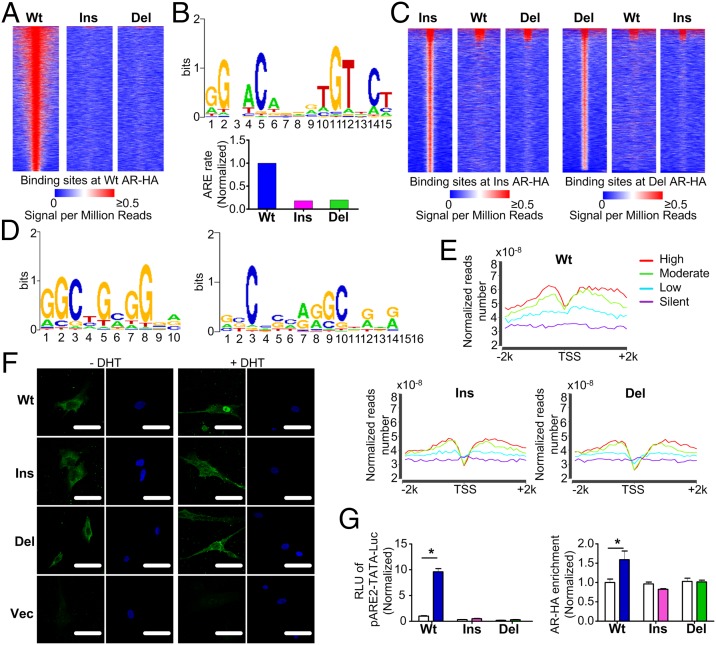
Fig. 3.
Expression of AR ASVs in primary GCs alters genome-wide AR recruitment patterns. (A) Heat map of the ChIP sequencing HA binding signal from −1 kb to +1 kb surrounding the center of WT AR-HA binding sites in GCs transduced with AR variants. Each line represents a single AR-HA binding site and the color scale denotes the AR-HA signal in reads encompassing each locus per million total reads. (B) Top-scoring motif in GCs expressing WT AR (Upper) and its enrichment in GCs expressing AR ASVs (Lower). (C) ChIP sequencing heat maps of ins (Left) and del (Right) AR-HA binding sites. (D) Top-ranking binding motifs enriched in GCs expressing ins (Left) or del (Right) AR. (E) Combined RNA and ChIP sequencing shows reduced AR-HA signal in regions flanking (−2 kb to +2 kb) gene transcription start sites (TSSs) in GCs expressing AR variants. The different color lines represent the genes, the expression levels of which are high (red), moderate (green), low (blue) and silent (purple). (F) Primary GCs transduced with the control vector (Vec) or AR-HA variants were treated with DHT and fluorescently stained with anti-HA (green) or DAPI (blue, nuclei). (Scale bars, 50 μm.) (G) DHT-induced transcriptional activation of (left, luciferase assay), and recruitment of AR-HA variants to (right, ChIP assay), a classical ARE-luciferase reporter in HEK293FT cells (n = 4, *P < 0.05). White columns: DHT (-); colored columns: DHT (+). Data are presented as mean ± SEM.

