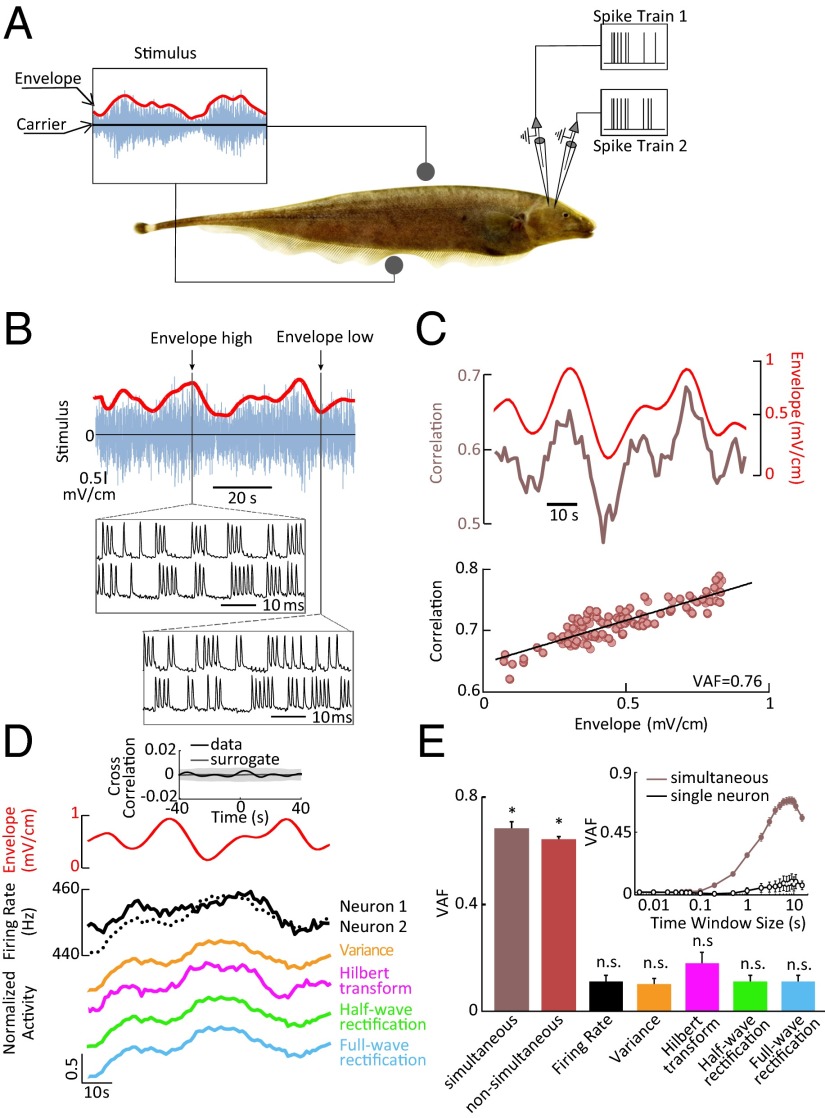
Fig. 1.
Correlated but not single-neuron activity encodes the stimulus envelope in weakly electric fish electroreceptor afferents. (A) Electroreceptor afferents were stimulated with a noisy waveform (20-Hz cutoff frequency) (blue) whose amplitude (i.e., envelope, red) varied independently and consisted of low-pass–filtered white noise (0.05-Hz cutoff frequency). (B) Time-varying stimulus (blue) with zero mean (horizontal black line) and its envelope (red). (Insets) Spiking responses from an example afferent pair to stimulus segments characterized by high and low envelopes. Note that, although the total numbers of spikes were similar in both conditions (21 for high envelope vs. 23 for low envelope), coincident spikes were more frequent when the envelope was high (15 for high envelope vs. 8 for low envelope). (C, Top) Time-varying envelope (red), and correlation coefficient (brown) from the same pair. (Bottom) Correlation coefficient as a function of envelope showing a strong linear relationship as characterized by a high variance-accounted-for (VAF). (D, Top) Time-varying envelope (red), and corresponding firing rates of both neurons (black). (Bottom) Signals obtained after applying nonlinear transformations to the single-neuron activity. (Inset) Cross-correlation function between the envelope and an example single electroreceptor neuron’s spiking activity (solid black) as well as uncorrelated surrogate data (solid gray). The band shows the 95% confidence interval of the surrogate dataset. (E) Population-averaged VAF values for the correlation coefficient computed from simultaneous recordings (brown; n = 16 pairs), nonsimultaneous recordings (red; n = 153), as well as for single-neural activity after applying either no transformation or the same nonlinear transformations as in D (black and colored bars; n = 32). No significant difference in coding performance as quantified by VAF was observed (P = 0.12, rank sum test, df = 168). The asterisk (*) indicates statistical significance at the P = 0.01 level using a Wilcoxon rank sum test. n.s., not statistically significant. (Inset) VAF computed from correlated activity of pairs of afferents recorded simultaneously and from single-neuron activity as a function of the time window used to calculate the correlation coefficient. The filled circles indicate statistically significant values from zero at the P = 0.05 level using a t test. The open circles indicate that the values were not significantly different from zero.

