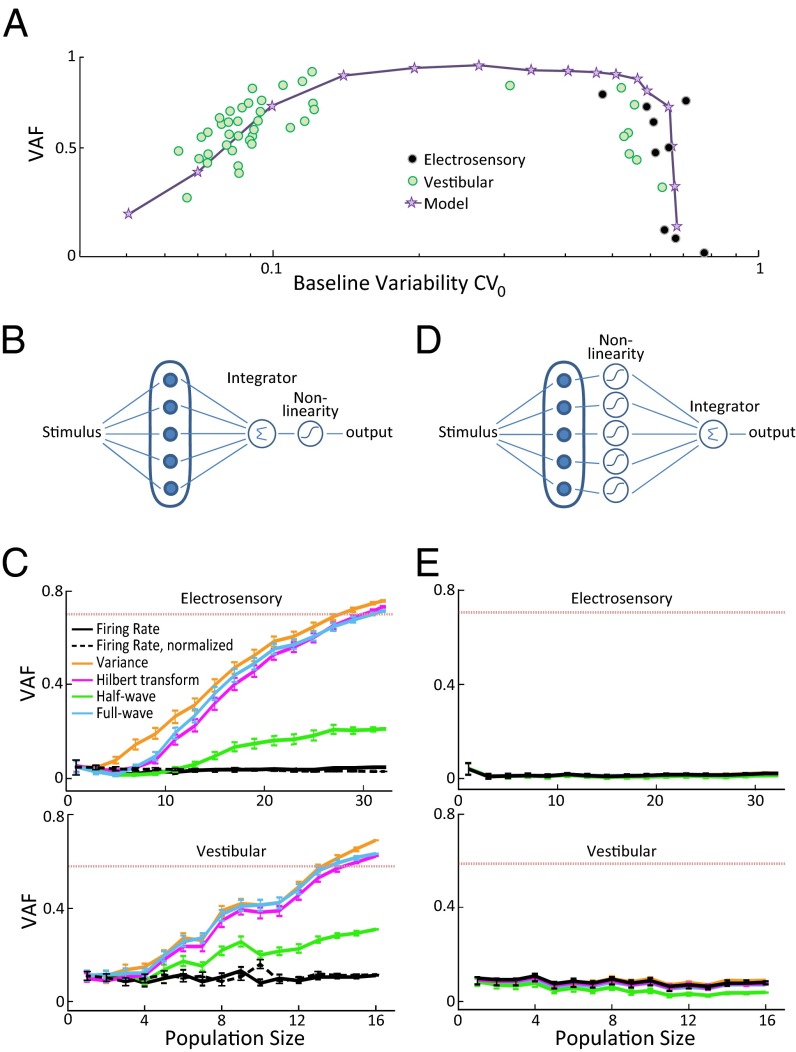
Fig. 4.
Can the brain decode information carried by correlated neural activity? (A, Top) VAF obtained from the correlation coefficient as a function of baseline variability defined as the geometric mean of the coefficient of variations for pairs of electroreceptor afferents (black circles), vestibular afferents (green circles), and variability defined as CV0 from our model (purple stars) when we covaried both noise intensity and bias current (SI Materials and Methods). We note that there are few data points in the intermediate variability range: this is most likely because the probability of finding vestibular afferents in this range is relatively low (15, 42). (B) Schematic of a physiologically realistic decoder for which the individual afferent neuron’s activities are first averaged before applying a nonlinear transformation. (C) Performance of the decoder described in B quantified by VAF as a function of population size for the electrosensory (Top) and the vestibular (Bottom) dataset. The population-averaged value obtained from the correlation coefficient from neuron pairs is also shown (dashed red line) for comparison. (D) Schematic of a decoder based on applying a nonlinear transformation on each individual neuron’s spiking before averaging. (E) Performance of the decoder described in D quantified by VAF as a function of the number of afferents for the electrosensory (Top) and the vestibular (Bottom) dataset. The population-averaged value obtained from the correlation coefficient obtained from neuron pairs is also shown (dashed red line) for comparison.

